The Vulture Strategy against HFT

Hi, my name is Vulture Trader. I’m the scum of the Stock Market. Just as the jungle is full with predators, I’m in the lowest range of them, but still dangerous.

I have no money to pay for expensive collocation servers close to the stock exchanges. I have issues paying my Bloomberg terminal every month but I’m surviving and you want to know how?

 A vulture survives chasing the Lions and higher rank depredations in the jungle, eating from their left overs but sometimes, just sometimes, we can steal some food from them. I do exactly the same. I build algorithms to sniff movements chasing moment ignition, Stop motion or Micro flashes to trade.

I go into dark pools trying to hide from HFT but they always manage to get orders in front of us. I beat the HFT with an Algorithm that spots the right % of the movement from the spread, I just try to build smarter algorithms and maximize performance and keep monitoring patterns with a group of Vultures working under my guide. Smart applied mathematicians, Econometrics and PhD’s programmers, the Vulture Traders you can call us. Just as Vultures we can look from above, Lions and Cheetahs can’t.

Let me be honest with you. Racing against HFT is like racing against Usain Bolt… Have you seen his legs? I’m just the finalist not even Bronze medal. I have no super computers and indeed my computers sit too far from the US Stock Exchange. So how can you win this race? Buy acting like a Vulture, yes Investors, like our friend Bill Gates said “keep your friends close and your enemies closer”…

 Analyze their moves, observe their behavior and know when to get in to rip-off some meat. By detecting their moves and by analyzing the right moment to come in. Just like vultures.

The Stock markets parallel universe: HFT Traders and Classical Investors collide

albertIf you are familiar with physics, you know the story of physic laws that don’t work together: Quantum and Classical mechanics. Did you know that Albert Einstein dedicated the rest of his last living years on Earth to consolidate both theories? He died trying and until now, it has not been achieved,despite all the geniuses working hard. We don’t know when the next Albert Einstein will be born and be able to consolidate both laws.

The same is happening with HFT and Classical Investors, their methods and ways of trading are so different that these problems are becoming, increasingly difficult to solve, to consolidate and have rules for both sides where they can play fair.

HFT traders and Classical investors are living in parallel universes. The Classical investors uses fundamental/technical analysis to trade. HFT uses math, computers, low latency and pattern discovery to trade. The long time investor analyses the companies and their financial situation in order to decide whether or not he should buy or sell the stocks. The Quant is clueless about the financial status of a company, it is irrelevant to his work, and he let computers decided when to buy or sell based on parameters and statistical data modelled in algorithms. However the parallel universes collide on one wormhole: The Stock Exchanges. This is where both universes meet and something that is not supposed to happen, occurs: They trade together.Wormhole_v2_by_Acidcliff

Try to unify Classical Isaac Newton’s laws with Quantum mechanics: It does not work. The same, we have a similar problem here, the methods used by HFT are so different from traditional investing that its making both universe collide. The flash crash is an example of this collision but there are many events happening, small collisions with Micro-Flash crashes that are putting pressure in the wormhole called stock exchanges.

Liquidity is at risk on both sides of the universe. HFT absorbs and dumps liquidity into the markets at the speed of data packages travelling across networks. The traditional investor is at risk of taking decisions based on HFT activities that can damage his portfolio. Who wins? Who is wrong? If Traditional investors stop one day trading, HFT will be out of business. It will be a disaster and both universes will collide.

The approach taken by Credit Suisse bank is very smart: Avoid trading when HFT strategies applied. It’s like, don’t use Quantum mechanics when solving issues related to Classical mechanics. However, the little investor needs the power of computers to identify the “patterns” caused by HFT. This is his biggest disadvantages. Maybe is time to sell an algorithm for traditional investors to know when not to trade as Credit Suisse bank is doing.

Any theories you can launch to solve this problem?

Feeding freenzy on the Micro Flash! Piranas all over the places

This Micro-Flash was a great feast for Algos. All these movements were a wonderful dance, if the algo has been properly trained this was a great opportunity.

On April 21, 2014 there were 21 micro-flash crashes events (up and down) over two short periods of time. The first event began at 10:50:18 and claimed 13 stocks, while the second event began approximately 4.5 minutes later (10:54:46) and claimed 8 stocks. Many other stocks had significant sudden moves but didn’t meet our strict threshold for being classified as a micro flash crash event.”

Please!!! Keep on coming

http://www.nanex.net/aqck2/4613.html

Welcome to my little shop of Horror: Perfecting and feeding Andrew II to maximize your PnL

Little-Shop-of-Horrors_2

In the book “Broken Markets: How High Frequency Trading and Predatory Practices on Wall Street are Destroying Investor Confidence and Your Portfolio” the authors Sal Arnuk and Joseph Saluzzi have a nice allegory with the little shop of horror film. Indeed the allegory is indisputable and very familiar with the reality of HFT. A small mistake in the book is that the plant is called Seymour instead of Andrew II and Seymour is one of owners of the plant.

In the film, the Nerdy flourish Andrew and Seymour who is the owner of the plan, they both have found success with this magic plant however the plant only eats humans! Success comes at a high price: other human lives. In our HFT reality this is quite similar. HFT is a big “Andrew II” but small HFT shops are feeding their own plants: the algorithms joining the feast and they feed on the markets movement without considering the real value of companies. Yes, HFT trading is taking a huge advantage above the rest of the classic investors that hold stocks for long term. Do we really know the effects on the stock prices for a long term investor or worse, what is the chance of a next Flash Crash to happen? I invite you to read Broken Markets because it will open your eyes.

Meet  Andrew II

A Quant does not know anything about the companies they create algorithms for to trade the entire day. Indeed to my surprise, there is not even any complicated math involved in this process. Most of it it’s Statistics, to be exact, standard deviation and regression analysis. Coming from a field such as Cryptology, this is not that complex.

The analysis involves looking for patterns in the charts. Observing charts and prices is the key to create working algorithms. Then we observe and extract parameters affecting these prices. We can use regression analysis, to understand which parameters are affecting the outcome. The reason why HFT wants PhDs is their capacity for research. Most of the methods require knowledge of quantitative approach however qualitative is also possible, it depends on the Quant’s approach.

Create and feed the monster: Quantitative Approach, Data and Research

If we look for patterns the entire day, we can easily adapt the simple algorithm example of Quantopian website and add parameters to it. We need to feed our knowledge first with data. This is where it gets challenging because we need data. Market data feeds is our primary source, they provide many parameters such as: Order Book, Prices ,Moving Average, Depth, Levels, Magnitude, Volatility, Best Bid/ Ask price, Spread, Volume, History volatility etc..

Which of this parameters have more influence in the price and how can we program decisions based on these parameters? Lets examine the Simple Algorithm example from quantopian website

Quantopian Example

If the price of the security is .5% less than the 3-day volume weighted average price AND we haven’t reached our maximum short, then we call the order command and sell 100 shares.  Similarly, if the stock is .5% higher than the 3-day average AND we haven’t reached our maximum long, then we call the order command and buy 100 shares.

This simple strategy handles 3 parameters: Volume average, Maximum long and Maximum Short. Exercise:

Considering momentum ignition as a trading strategy, which parameters do you consider important to add in the algorithm? (Find answers on next blog)

News: a heavy parameter in the equation

The fact that a quant does not know much about the companies, does not mean that he should not understand what is going on in the industry, especially the behavior of the stock exchanges. In fact, one of the biggest parameters affecting prices is news. News can be considered as a parameter with a big coefficient. Applying multiple regression analysis, we could also determine the coefficient for news. The problem is that machines cannot interpret news. One of my little monsters is the News Interpreter. The interpreter uses semantics and artificial intelligence to understand the news effecting the prices. Based on the news feed we can provide a weight to the coefficient and this one can trigger a buy or sell order, even better, we might decide not to trade if we know that our algorithm will not be able to react properly to the news.

In the next blog I will continue with a nice example of trend pattern analysis and how to continue developing your strategy


Creating Dirty Strategies in Algorithmic trading: A Momentum Ignition strategy

By now, it is no secret that momentum ignition has a deep connotation in the stock market. A report from Credit Suisse bank exposes in details how to identify the bad practices in HFT. Keep in mind that while some HFT companies uses Momentum ignition to spark the handle, other algorithmic trading companies are in the hunt for such “ignition”, to handle behind, just as vultures waiting patiently the entire intraday. If you wonder how it works, let’s get into details.

The story of DirtyAlgo

Let’s begin by telling you a little story about a company called “DirtyAlgo”. DirtyAlgo is a small sweatshop algo trading company in Bangladesh who has  at its services 10 people, 3 work on infrastructure and the rest are Traders that know how to program in C++. They have invested quite awful  time and money developing algorithms, unfortunately they are not that profitable. Then one Trader, lets call him Rajeesh, noticed a strange pattern occuring consintently in the stock market, especially after the crash in 2008. Prices will go up as a burst and in a matter of seconds they will go down, maybe the  volume will increase during that period, lasting a minute but after that, the price of the stock will stabilize.

Rajeesh kept on studying these bursts and noticed that he could create a strategy that can benefit from this sudden and unexplainable changes in the price. He noticed how the volume increases , meanwhile the history volatility of the stock hasn’t been that extreme to explain why such as stable price suddenly changes,  since there was no external reason for it to happen.

Rajeesh developed his algorithm and started testing his theory. He kept adapting it until he was able to ‘join the hunt’ properly, so he will sell short and buy low at the right moment. He began with small limit and kept on increasing it, making his total  PnL one day USD 120,000!  Now, you know how he did it? Keep on reading.

Understanding Moment Ignition

As explained in the report “Momentum ignition does not occur in the blink of an eye, but its perpetrators benefit from an ultra-fast reaction time. Generally, the instigator takes a pre-position; instigates other market participants to trade aggressively in response, causing a price move; then trades out. We identify momentum ignition with a combination of factors, targeting volume spikes and outsized price moves

The market participants: These are other algorithmic trading companies waiting for the ignition or unfortunate victims that might think this is the right moment to handle. The Credit Suisse reports explains how to identify these movements to avoid being victim of this predatory strategy, however some algo-trading companies are in the hunt to become participants in the butchery so they are looking for this movement to handle.

Creating an algo-strategy to wait for the ‘sparkle’

Our mission is not to judge how honest or not is to profit from moment ignition, but to show you how can you also become a vulture in the game.

As described in the report we need to identify

  1. Stable prices and a spike in volume
  2. A large price move compared to the intraday volatility
  3. Reversion

 Gather data to analyze volume spikes and outsized price movement

The report was written in 2012, so by now the information regarding the observed pattern might have changed. As described in the report:

momentum ignition occurred on average 1.6 times per stock per day for STOXX 600 names in Q3 2012, with almost every stock in the STOXX600 exhibiting this pattern on average once a day or more. In addition, we note that the average price move is 38bps (but over 5% are more than 75bps, with some significantly higher – see Exhibit 20), and the time it takes for that move to occur is approximately 1.5 minutes (see Exhibit 21). While 38bps may not sound like a big move, it is a bit more significant when compared to the average duration of these events (1.5 minutes) and the average spread on the STOXX600 (approximately 8bps).

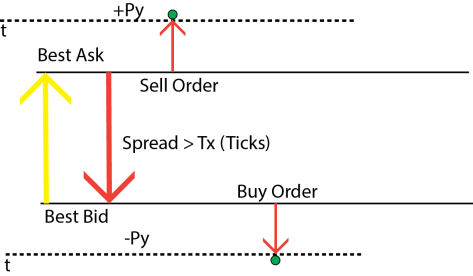
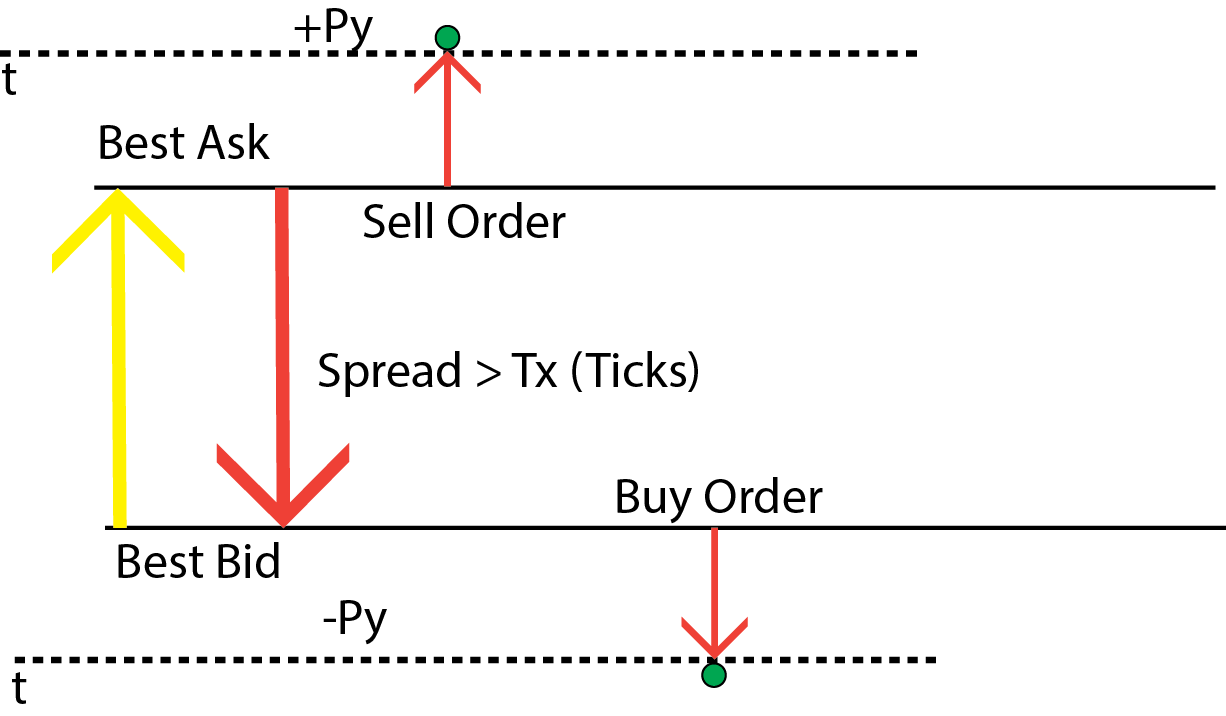
For the strategy to work properly, it is essential to identify a pattern on the movement price and set a best moment/time in milliseconds to buy or sell. Using a Ticking Strategy as our basic strategy, we could determine when to buy or sell after observing the average movements. By keeping no positions, it is essential to calculate the time of the movement (t), the price in correlation to the Best Bid or Best Ask price total in BPS.

Py is the new price after the movement that we want to buy or sell. It is essential to determine the average price movement and the time the move occurs, so you can calculate the moment to sell/buy and get out of there before the volume gets down.

Volume and Volatility are 2 parameters to keep measuring while t(time) is important to trigger the sell or buy action.

Indeed is not that difficult once you understand  the movements. The tricky part of creating profit is to calculate the correct BPS and the right time to get out of that position , maximizing your PnL.

tick

Deciding an Algo trading system architecture: Market Data Feeds API- PART 1

On another blog, we mentioned the most important components to be considered for an of an algo system. In this blog we handle one of the most important components: The Marker Data Feed handler component

In a Market data feed (mdf) system we have , the MDF providers and the program consuming the feed. There are multiple alternatives to MDF providers from open source to the most expensive ones

The free ones such as Yahoo, Google are available but for a robust Algorithmic trading system you would have to consider more real time data feed systems such as Bloomberg or Reuters. Bloomberg Terminal or Reuters come with a price tag, there are other data feed systems at a lower price however for the design of the architecture in our example, Reuters and Bloomberg will be explained in detailed.

Right now, the focus is not about choosing a Market data feed provider however the entire development of the component handling the raw data from a MDF provider will determine the course of the programming and the solution you need to take. Reuters and Bloomberg have API’s that allow programmers to consume certain methods and adapt the program to their needs.

Bloomberg API

Since 2012, Bloomberg has made their API open source. This allows developers to experiment and create solutions for the financial market however as mentioned on their website “Bloomberg is offering this programming interface (BLPAPI) under a free-use license. This license does not include nor provide access to any Bloomberg data or content. If you wish to use this API to access Bloomberg data, you will need a Bloomberg service subscription, and should contact the nearest Bloomberg sales office in your region.” Therefore we need a way to test a feed. An alternative is to pay for a developer account which costs USD $ 2000/month. Good news is, there is an alternative to simulate the data feed: Bloomberg API Emulator (.Net, Java, C++) .

Choosing a programming language

The BB API can be consumed using different languages and operating systems such as:

WINDOWS
C/C++ v3.7.5.1 Download
.NET v3.7.1.1 Download
Java v3.7.1.1 Download
Perl v3.5.0.1 Download
Python v3.5.5 Download
Python Binary Installer (for 32-bit Python 2.6) v3.5.3 Download
Python Binary Installer (for 64-bit Python 2.6) v3.5.3.3 Download
Python Binary Installer (for 32-bit Python 2.7) v3.5.3 Download
Python Binary Installer (for 64-bit Python 2.7) v3.5.3.3 Download

If we choose .NET we have also options such as using specific programming languages like C# or VB.NET

The BB API has also a Developer guide which explains in quite detail how it works. These examples are provided in C#

Developing Market Data feed handler using .NET C# Bloomberg API

Before starting , we strongly advice you to read http://www.openbloomberg.com/content/uploads/sites/2/2012/03/blpapi-subscription.pdf which explains in detail a use case handling subscription to Instruments

The .NET BLB API comes with multiple examples. Version of the Visual Studio Solution of .NET projects is 2008 but they are easily convertible to VS Studio 2013. Once converted, lets take a look of the example project SimpleSubscriptionExample

exampleBBAPI


As explained on the BLPAPI subscription document, the first thing that must be setup is to establish the session with the Bloomberg terminal server

session

The first part of the method (which runs a simple console file)  connects to a Bloomberg Server, which provides the market data. Since we do not have such server , we need to emulate the connection. Next part of the blog will show you how to create a server holding a dummy Bloomberg server and emulate the connection to fake market data


Using Quantopian to back test and create algorithms

There are many ways to test your strategies. One of these systems is “Quantopian” , a very nice web applications that allows you to create an algorithm using Python language, back test it and test it live.

The application has a nice interface for editing and very well explained comments in the code to change it.

The Sample algorithm executes a buy or sell action for an Apple stock.

As described on the comment:

“If the price of the security is .5% less than the 3-day volume weighted average price AND we haven’t reached our maximum short, then we call the order command and sell 100 shares. Similarly, if the stock is .5% higher than the 3-day average AND we haven’t reached our maximum long, then we call  the order command and buy 100 shares”

Key words to understand:

  • Volume: The number of shares or contracts traded in a security or an entire market during a given period of time
  • Average Price: A representative measure of a range of prices that is calculated by taking the sum of the values and dividing it by the number of prices being examined
  •  Short: Buying back borrowed securities in order to close an open short position
  •  Long: Holding an asset for an extended period of time. Depending on the type of security, a long-term asset can be held for as little as one year or for as long as 30 years or more

Building Algorithmic Trading Systems: Creating the right components and architecture

Quantstart website has a great post regarding the discussion around the best programming language for algorithmic trading . As you can read, there isn’t really the “best” one, but maybe the decision should be taken based on the best components and open source solutions in the market . Why? Because building low latency systems from scratch is not simple and many solutions out there have been tested. Why reinvent the wheel?

Before continuing , it is important to clarify that Algorithmic Trading is not equivalent to High Frequency. As explained  in this article: “high-frequency trading is not “black box” trading or algorithmic trading. It can implement those two things into an HFT strategy but again, they aren’t HFT-specific strategies. High-frequency trading is all about one thing: speed”

An algorithmic trading system is built configuring multiple components. Here we can mention the most important ones:

  • Market Data Feed component: Data coming from markets such as Bloomberg or Reuters
  • Services consuming data feeds: The market data coming from NYSE for example must be used by the strategies .The  “raw” data  needs to be properly formatted to be used by other components such as the strategies
  • Strategies : The algorithms making the decisions to buy or sell based on market data
  • Sell/Buy container: the component sending orders and placing a position into the stock market . This data is send to the broker
  • Monitoring components: systems built around the algorithmic trading components that monitor  issues
  • Interface: The component holding all the information of all the trading movements done by the strategies and the market. The interface allows the trader to intervene any time, change parameters or adapt settings
  • Stop Loss: Algorithm(s) in charge to stop the execution of a trade, setting a limit or stop to the execution of a trade.
  • Check and balance component: At the end of the day, a component must handle the reconciliation of all th e transactions done by the system to verify the transactions such as order placed and PnL (Position)
  • Logging: Very important. If something goes wrong in the code, we need to be able to go back and control the logs

The first thing to do is design an architecture and choose the elements we want to use. There are multiple solutions out there as described in this list. This provides an overview of interfaces which also partially handle the data feed too. Remember, in algorithmic trading, it is all about performance and the utmost use of capabilities of the computer memory the best we can.

To provide you with a clear example, let’s take the data feed component. Market data must be real time , the fastest it gets into the system, the more efficient the strategy will be able to react. This is one of the most important components in the system. If the data is outdated , the strategy will not be able to calculate its movement based on real time data feed. Imagine that the price of a Google stock is 1090.05 at 10:05:20:5678 am ( yes time is Hours:minutes:seconds:miliseconds) every single millisecond counts. The price of the stock changes to 1080.04 at 10:05:20:6090. In those milliseconds we have a difference of 10 dollars . Now lets imagine that the strategy has calculated that this price is the right one to buy or sell. if this information is outdated, the strategy will send a trigger to the Buy/Sell component and therefore at that moment, instead of buying at the price of 1080.04, the Buy/Sell component receives delayed data and it actually buys it at the price of 1092.01. Ouch! Here we can see why having a logging component is essential, to understand what happens and the issues regarding latency.

In the coming sections, each component will be handled and how to building explaining specifically which programming language based on a main architecture


Selling Algorithms that make millions